BRAIN MAPPING 3D HEATMAP
In collaboration with:
Charlotte Maschke and the Biosignal Interaction and Personhood Technology Lab.
Charlotte is a master’s student in the Integrated Program in Neuroscience at McGill University, she applies techniques from the area of artificial intelligence to data, recorded from the human brain. Her work gravitates around the concept of consciousness and how we can quantify it.
Introduction:
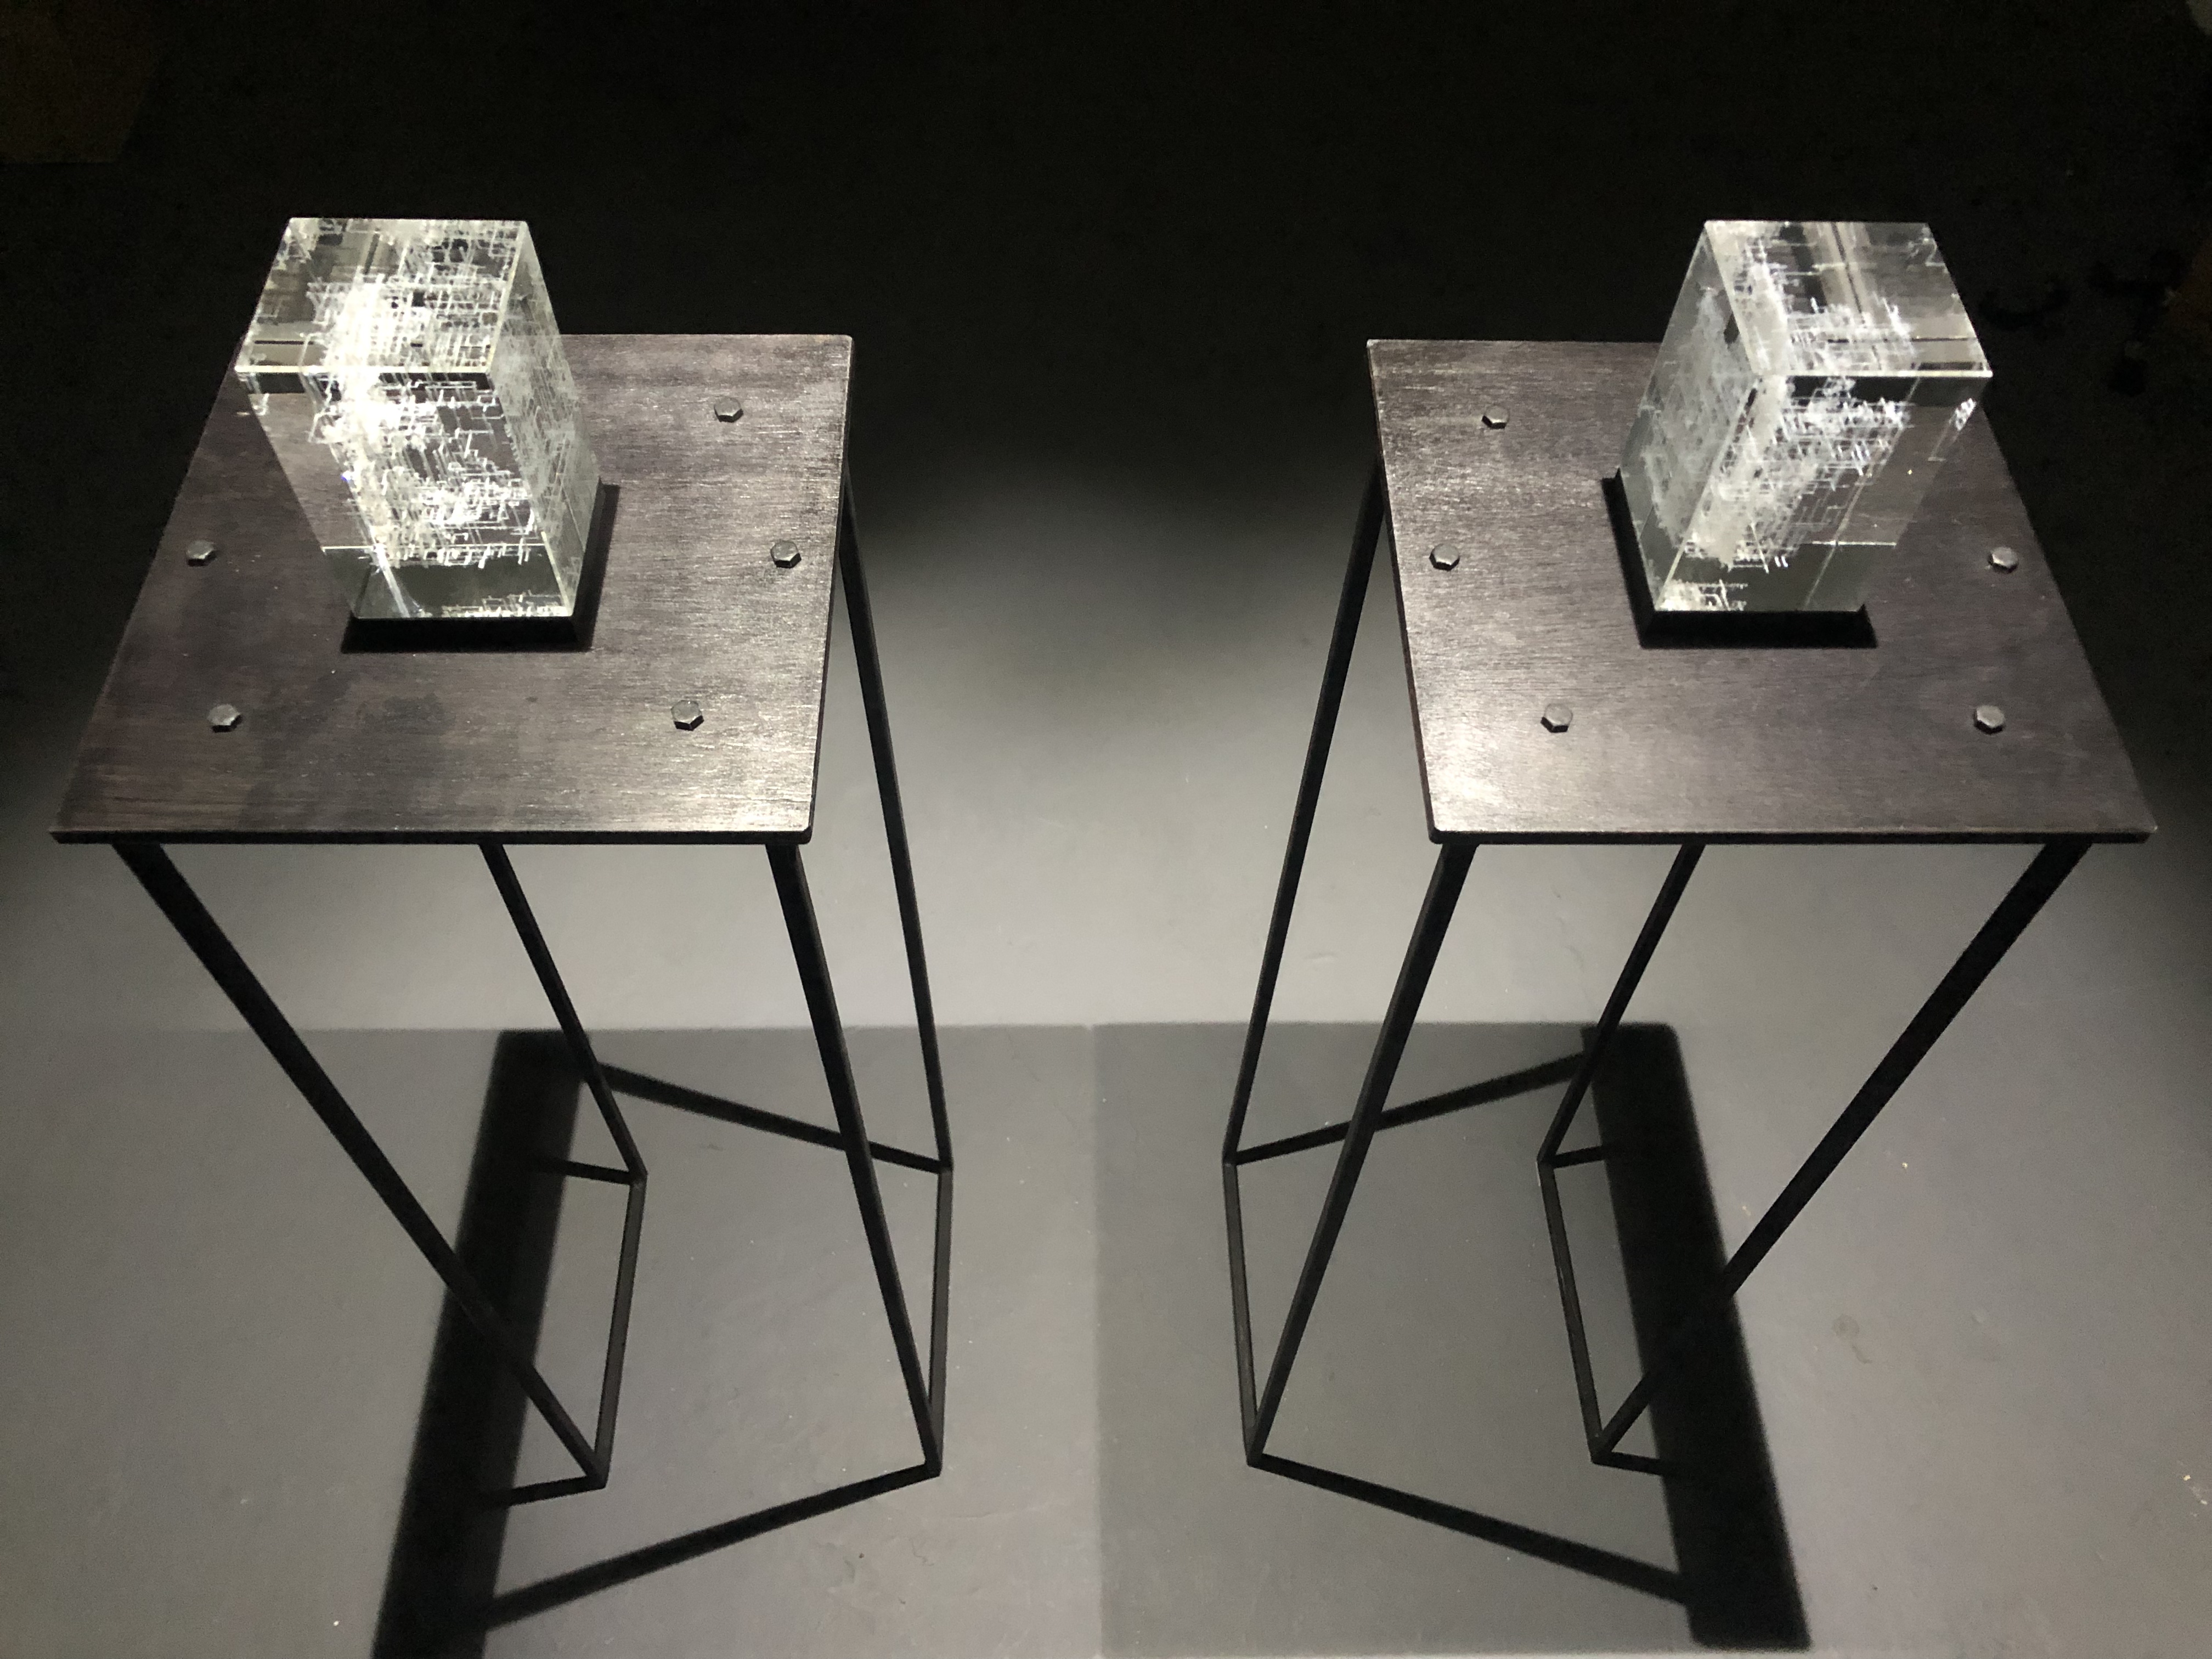
How to determine whether someone is conscious if they are not able to communicate or move? This project engages the theories of consciousness, consciousness disorder, and how to visualize brain states taking inspiration from the unicellular organism that is slime mould. The data is taken from a patient's brain at a resting state and a simulated unconscious state under anesthesia. The structures are a generative interpretation of functional connectivity data over time to create a three-dimensional heatmap.
From Motion to Stillness:
This project derives from the slime mould simulation for a data mapping project I made (find out more here). That set to offer a creative interpretation of big data through time within the motion and the literal interpretation of connection with ever-changing paths in the quest for the shortest roots from one area to the other depending on their relative connection level (functional connectivity). The project aimed to stir away from the classic means of data visualization interpreted from machine learning models.


Heatmap image of the functional connectivity for all 104 electrodes within a 1-second window
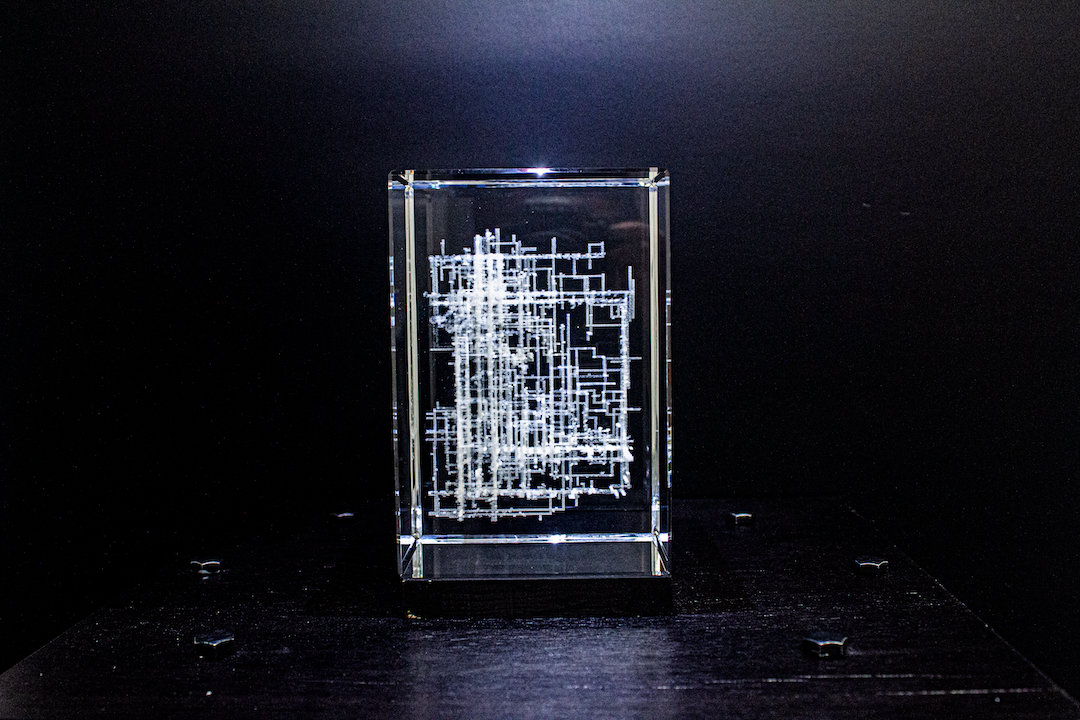
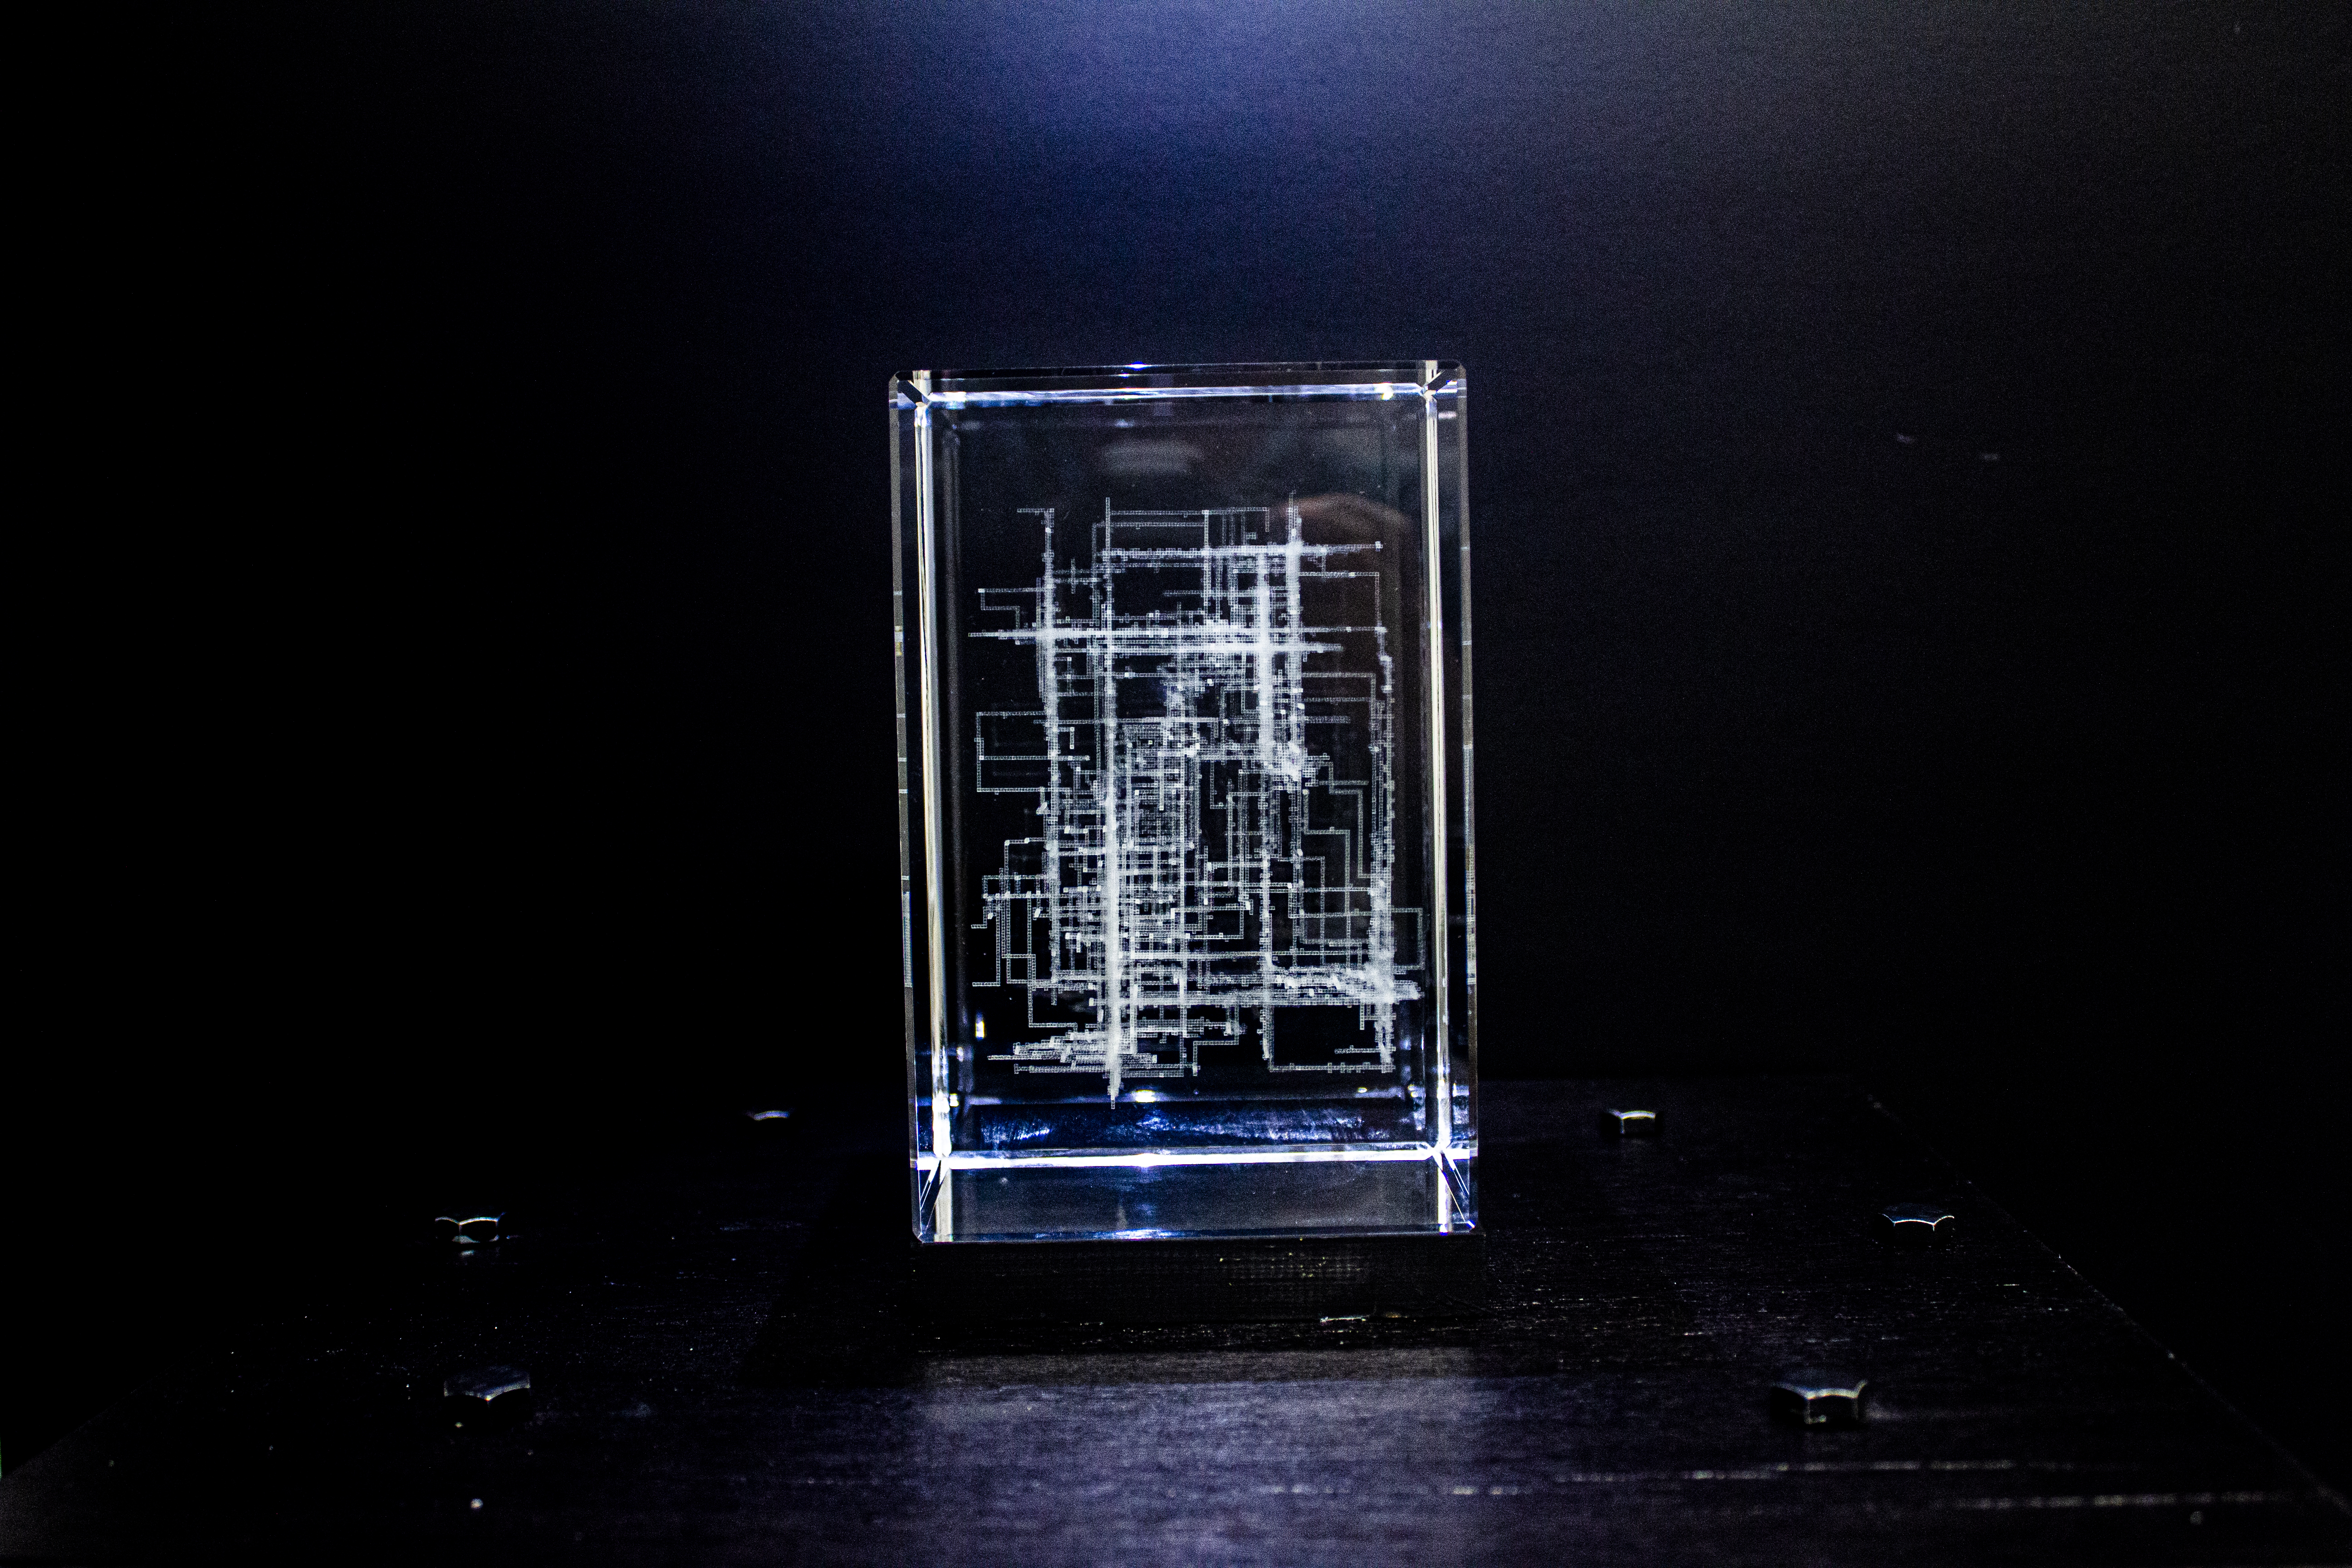
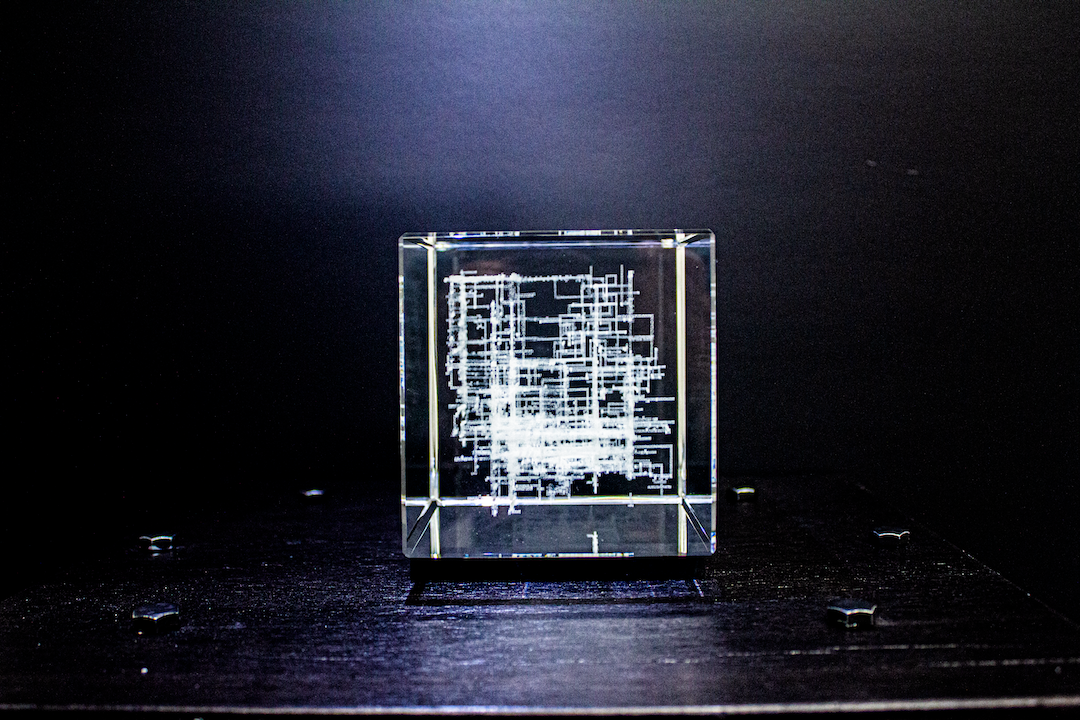
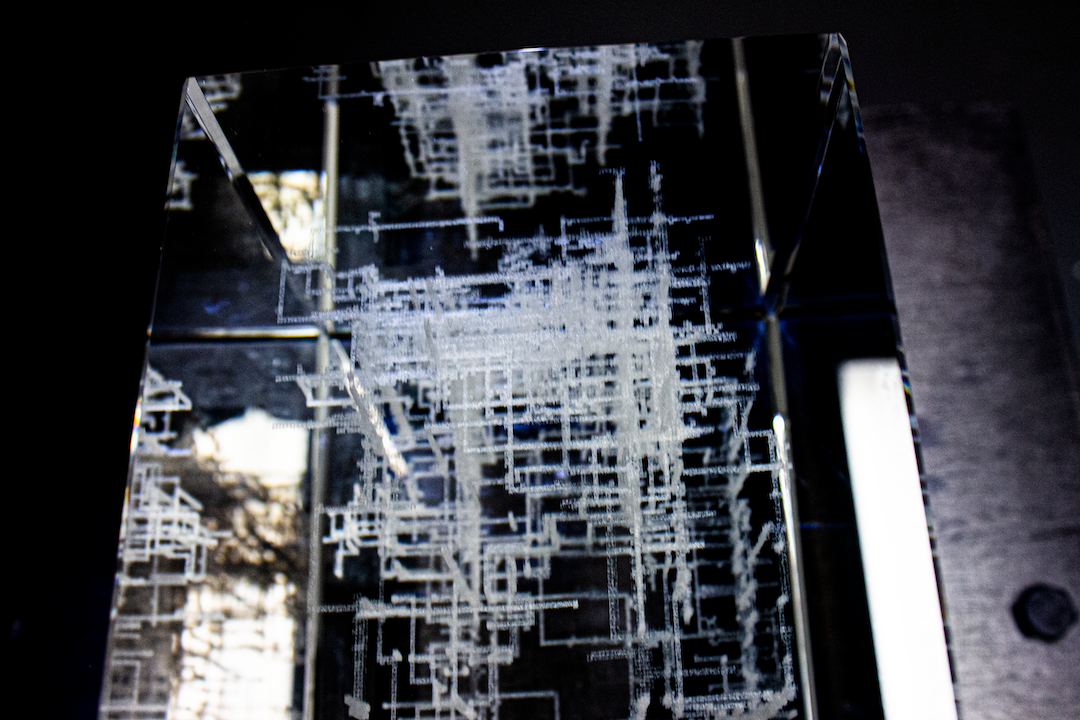
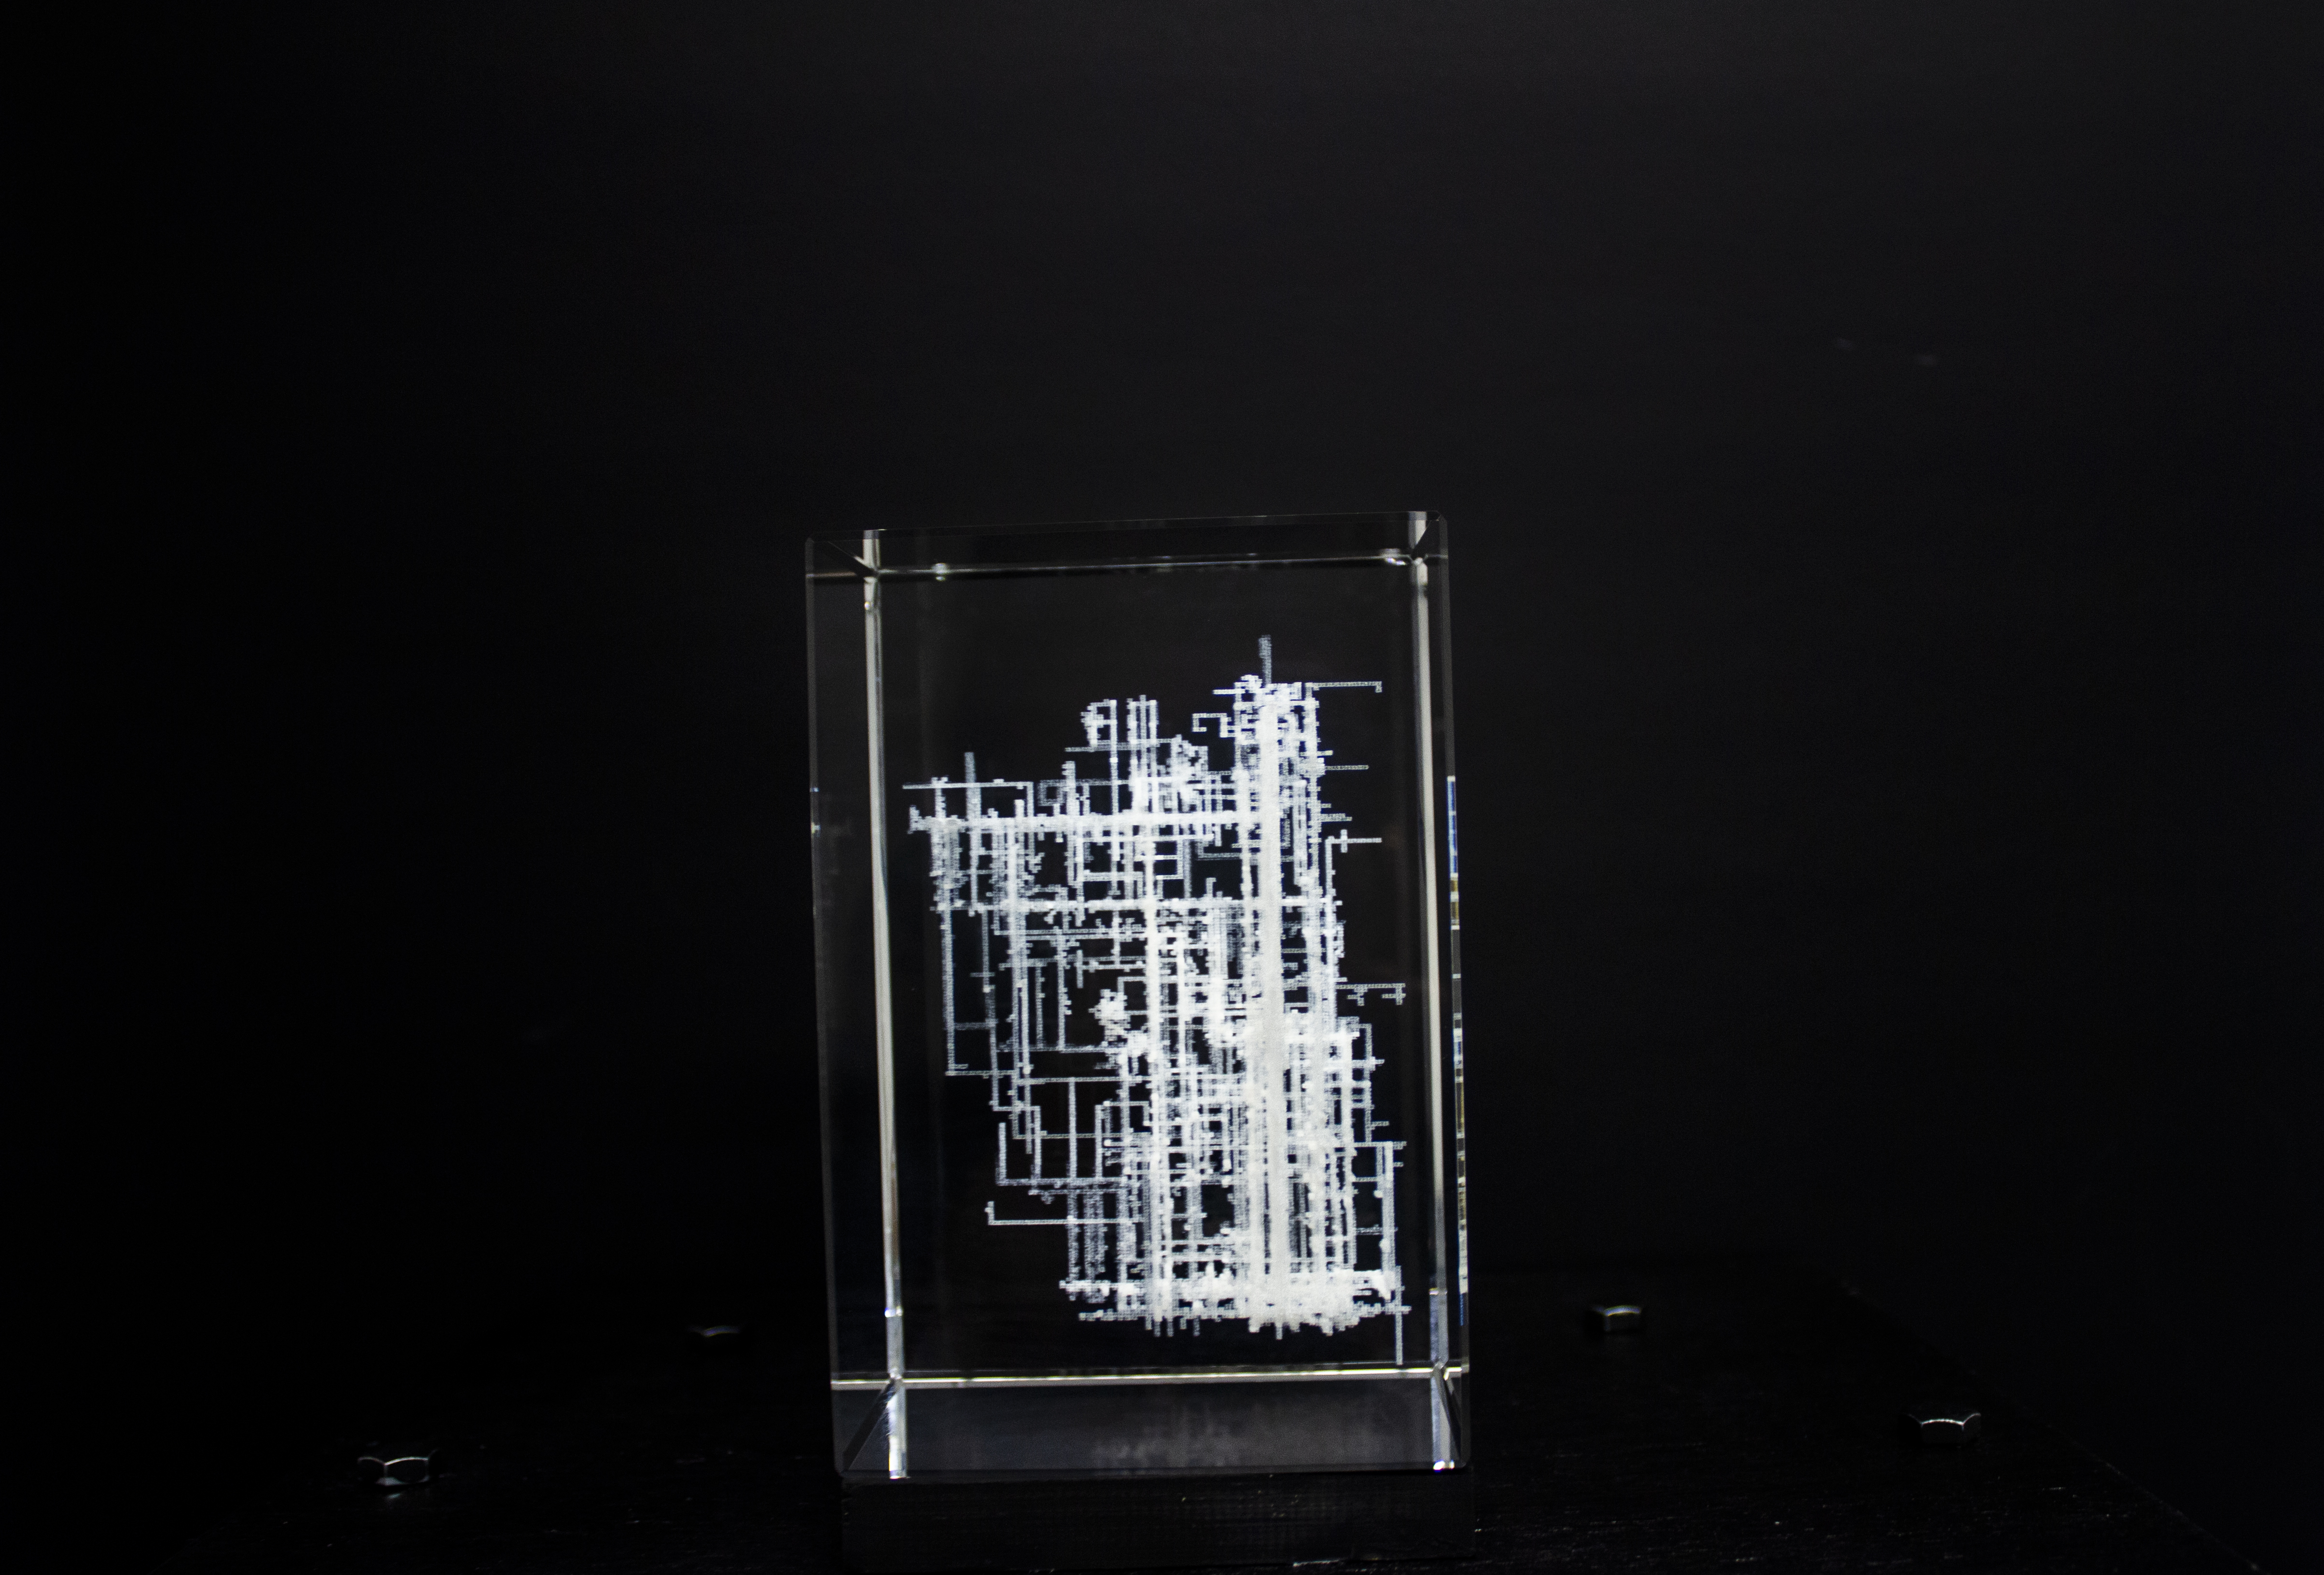
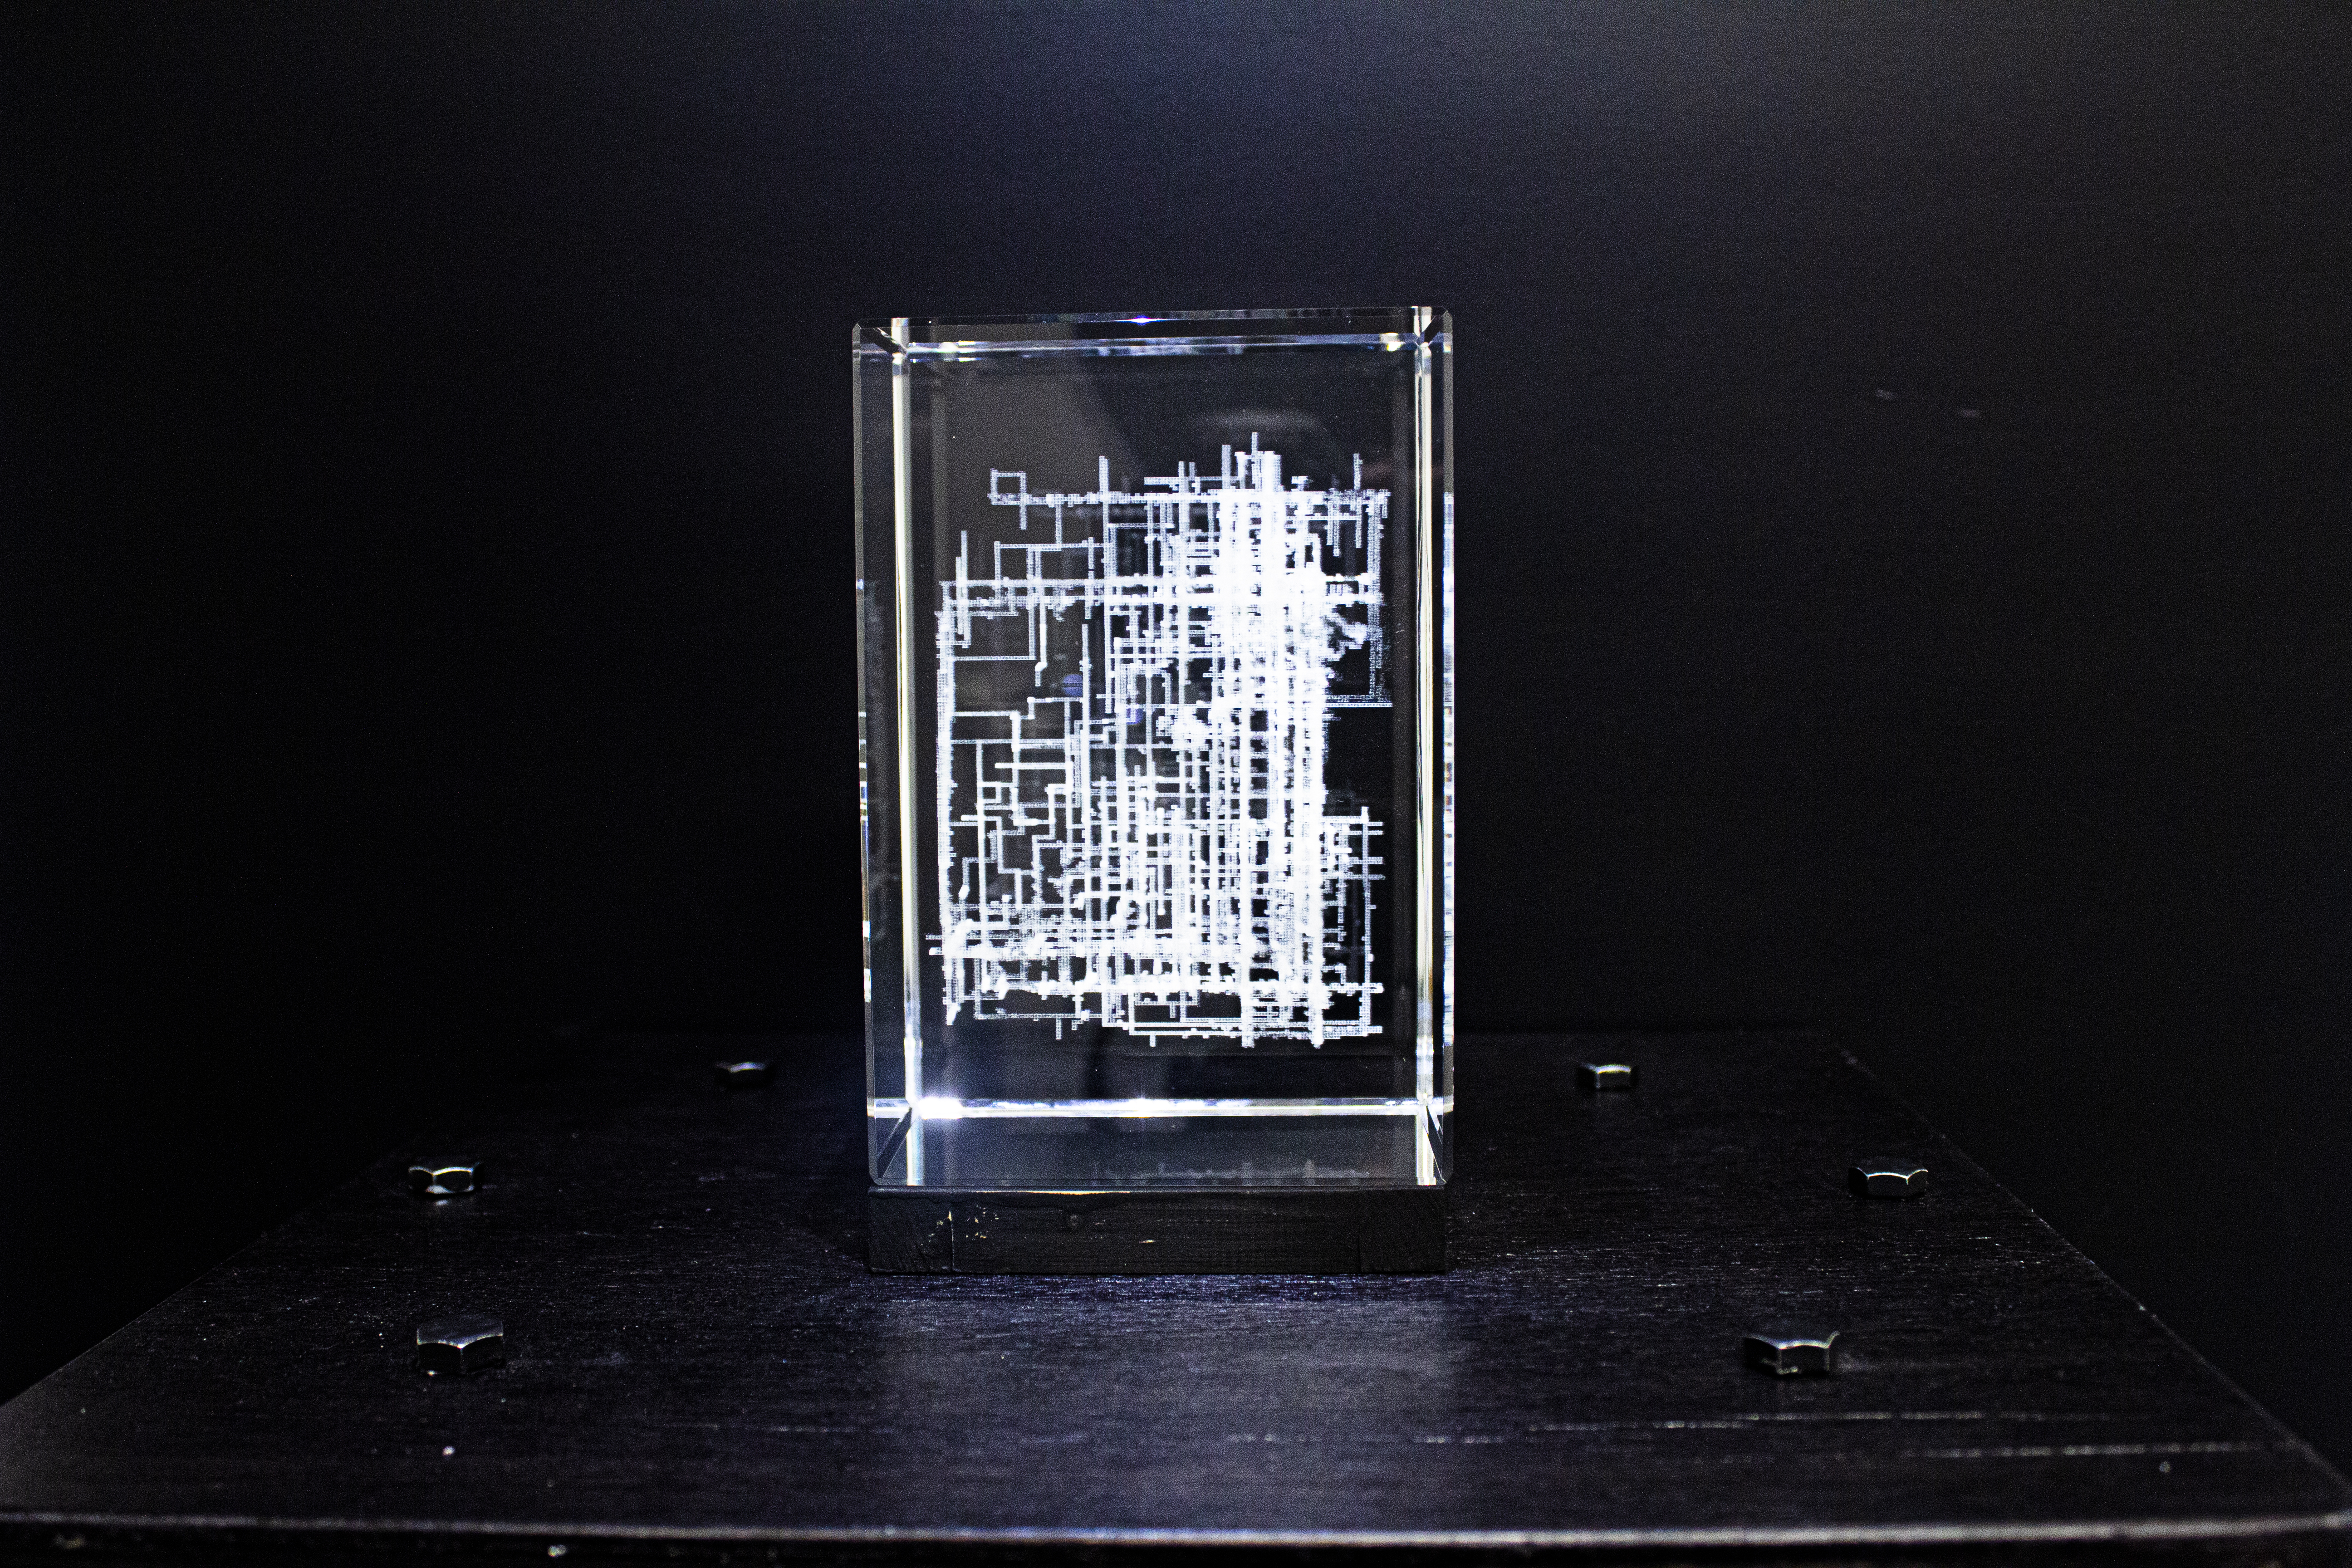
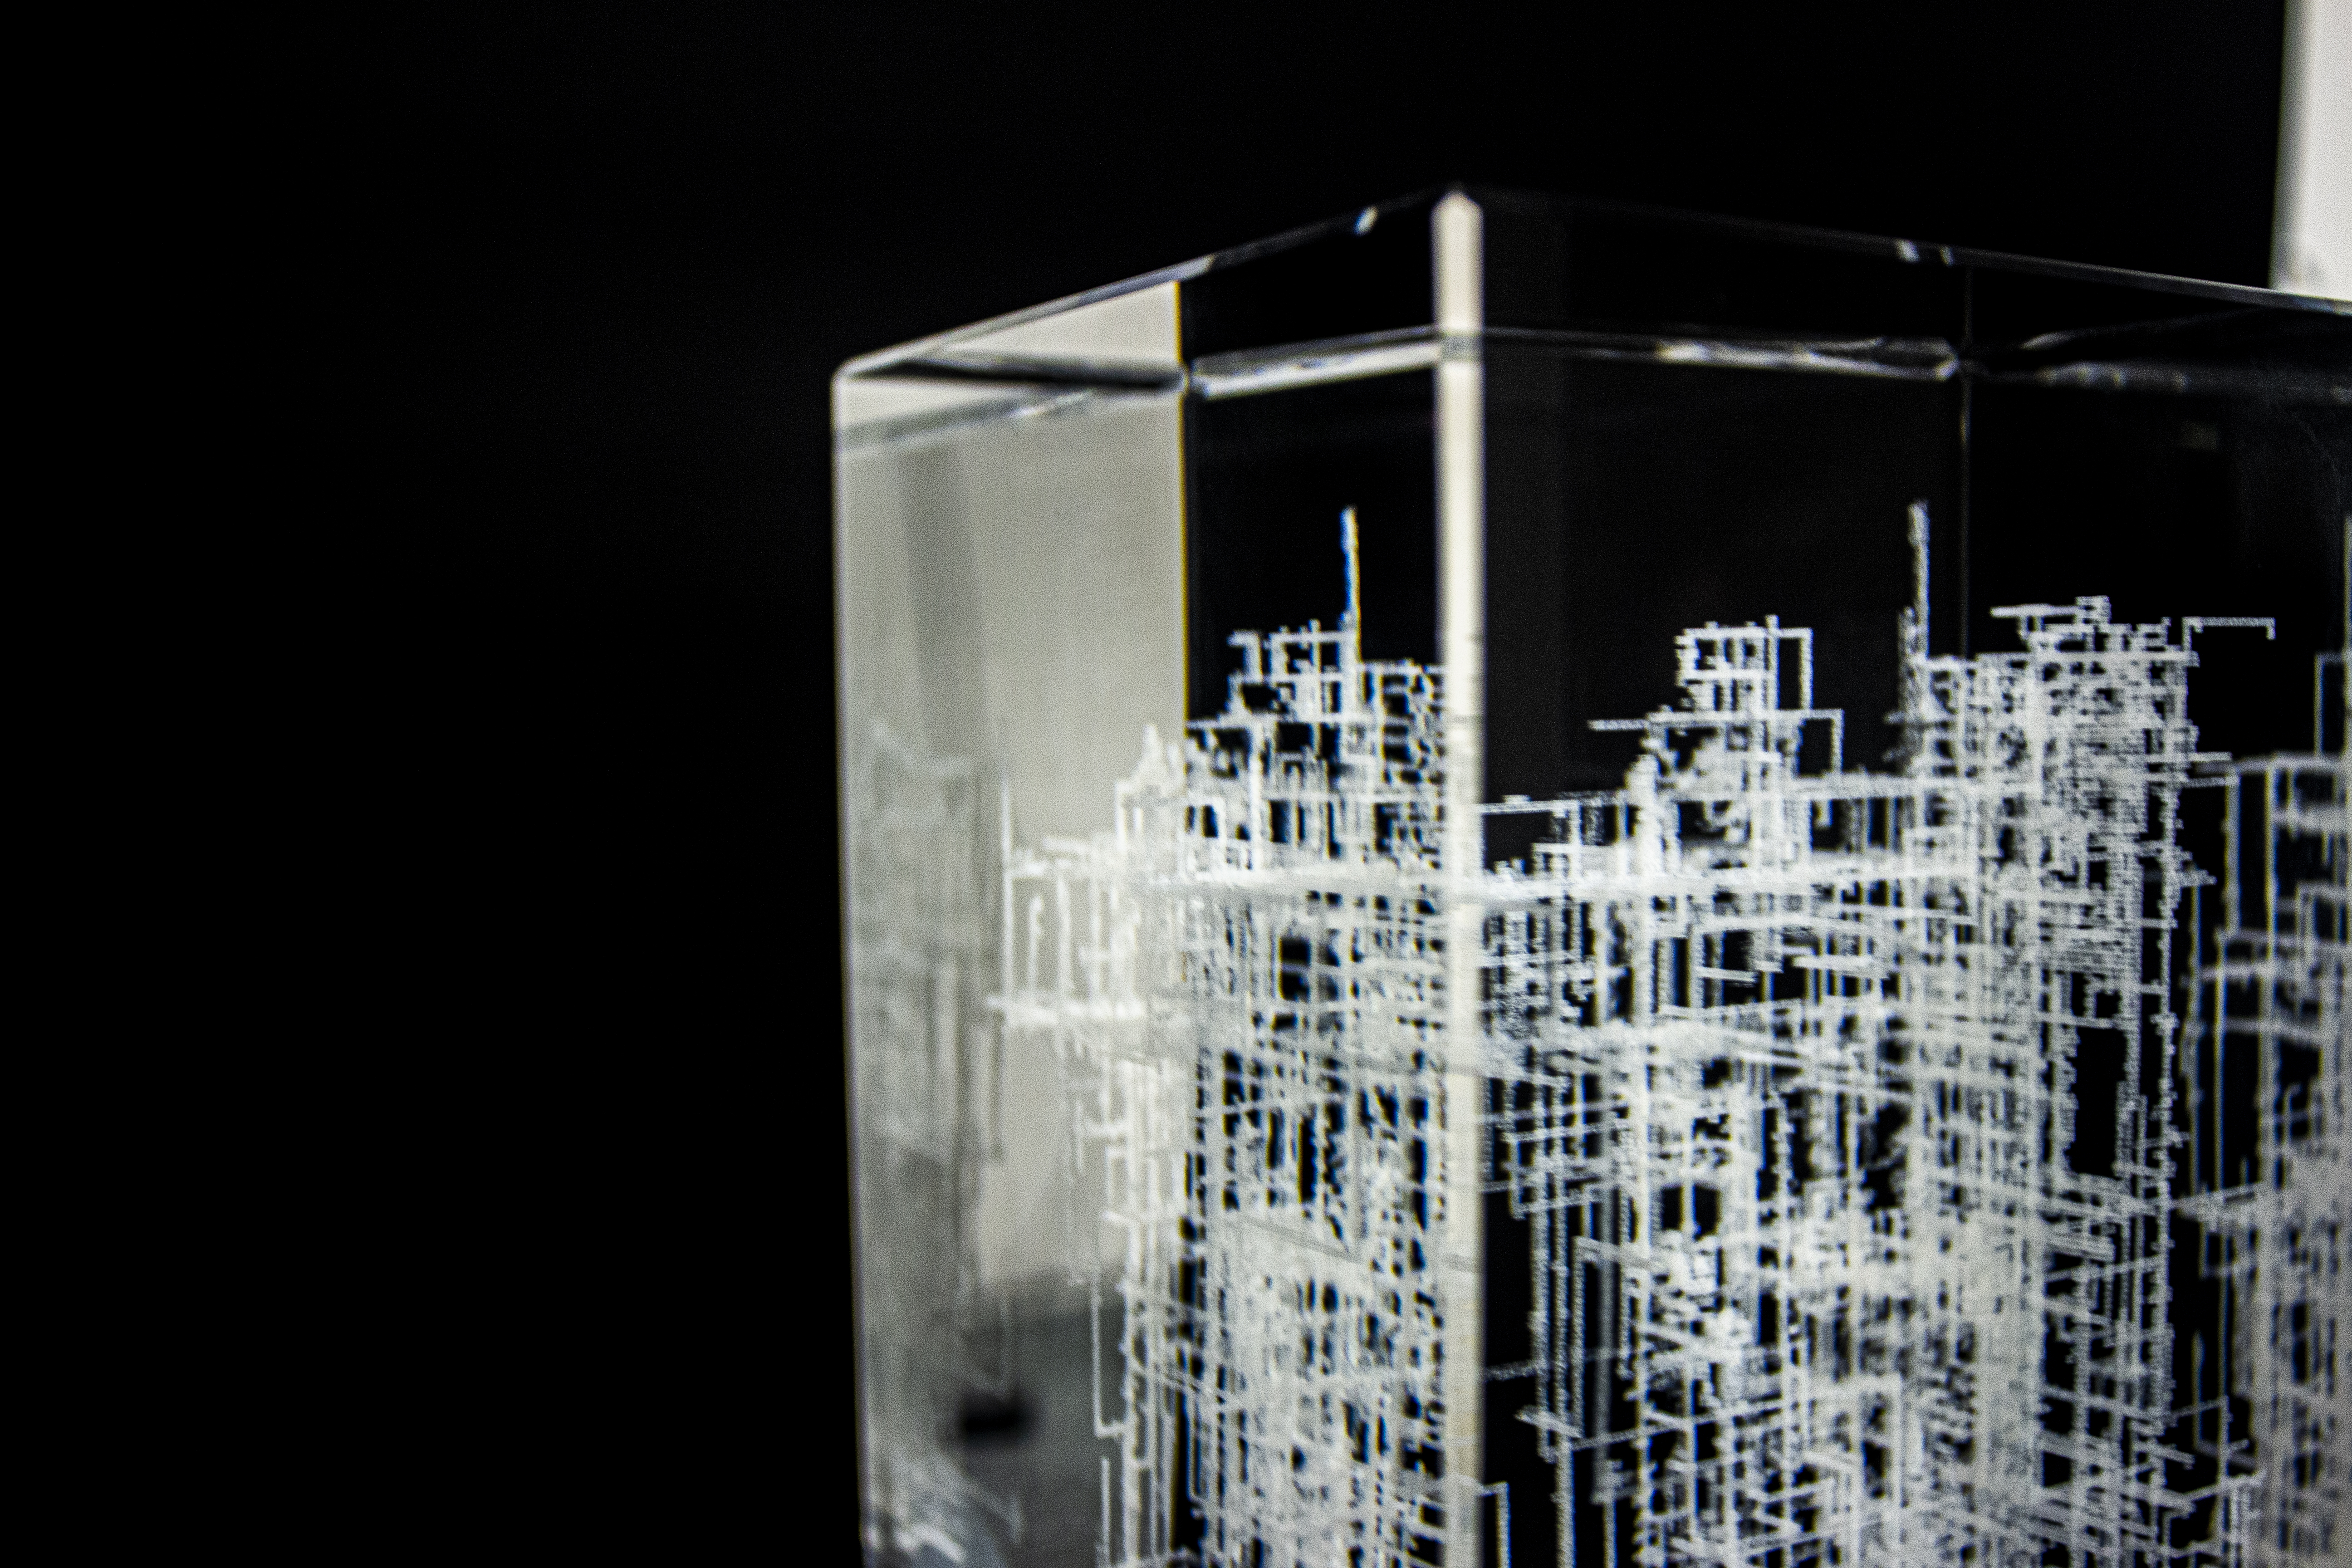
Now, for the crystal artifact, it takes inspiration from the data analysis process of functional connectivity data. As it is creating a heatmap from a given time lapse to visually interpret the connection force. For this 3D voxel animation project, the connection strength is used as line length (to go faster from A to B) and an alpha value, furthermore, the alpha is being affected by the accumulation of particles repeatedly passing on a voxel. Then, once in a while, the program suppresses the weaker alpha values by over time incrementing the threshold. As soon as it finishes going through the 283 rows, it then stops and saves the model as a point cloud. Thus, inspired by the heatmap, the simulation presents the most active areas by the number of paths leading to them or around them.
Fully conscious brain (baseline) crystal:
Artificially induce consciousness disorder brain (anesthesia) crystal:
The Data and Process :
The data is first taken from a patient's head with a 104 electrode EEG. In our patient’s case, he is scanned two times, first during his normal state and then again in an induced consciousness disorder state under anesthesia. Thus the process is to take physical data, convert it into digital, and then back to physical within a sculptural work. Using a slime mould simulation The work, in itself, is a presentation of the problem at hand, with a big dataset, where there’s a loss of data during the conversion process. In this project case, it is visually interpreted by the empty space.
Randomness:
To further derive the project from the cartesian heatmap there’s an inclusion of randomness. It takes the form of randomly selecting the option for the attraction direction X Y Z considering the particle's attraction point or a fourth option where the particle goes around aimlessly for a short distance if the connection level is too low. The other instance of randomness is in the starting position of the particle (the brain areas), where it is now different generative as it gives the simulation a more dynamic and interesting composition and pushes it out of scientific interpretation as the areas are scramble which makes identification impossible. Nevertheless, their connectivity force is still noticeably represented by a large concentration of voxels.
Improvements
Next steps, this artifact is both the first interpretation of data as sculpture as well as an introduction to the world of 3D computer graphics and voxels. The next step is to make the simulation more fluid and organic. Then, working with voxels bring about an awesome opportunity as fMRI are made of them thus the 3D slime mould simulation could possibly be started within a voxel model of the brain.
Conclusion:
This project is reappropriating the data visualization process that is heatmap by introducing and other variables with the shortest pathfinding stigmergy algorithm. The result is an engraved crystal block of 10 x 10 x 15 cm that engraved each and every voxel into a physical object.
Find more about my coding project here
Find more about my practice here
