Can you feel it?
by: Elisabeta Oprina
This is an invitation to become conscious of your surroundings and consider your feelings.
You could say natural and urban environments differ around some key characteristics such as speed, angularity, colour or sound. While these offer a wildly different sensory experience, what are the underlying psychological effects of these contrasts?
This piece uses code in an artistic approach to portraying scientific data and illustrating the meaning behind it. You will be taken along on a psychological study looking at the effect of natural and urban environments upon two mental health issues under threat by the current global situation: anxiety and depression.
CONCEPT & BACKGROUND RESEARCH
I developed the concept from a wish to rise beyond graphs when depicting abstract scientific data and towards a more visual demonstration. A principle such as the healing effect of nature, would benefit from such a portrayal by becoming accessible to a wider population. I first achieved this objectively, through a representation of data from a mental health study, followed by a subjective and immersive experience of the two opposing environments and their characteristics. This aims to put the viewer in an evaluative position: if a visual representation of a city, with a high speed, dark colours and angular lines feels so unsettling, compared to an organically moving, sinuous, bright scene, how does it really feel being surrounded by this all the time? Listen to the sounds, look at the data. What would you prefer if you had the option?
A pillar of this piece is the emerging mental health crisis which, incidentally, occurs with the increase of urbanization (Turner et al 2004). While it brings commodity and increases happiness and opportunities, urbanization comes at a cost. My piece depicts contrasting details descriptive of natural and built settings, putting them at the base of the mental health cost associated with our decreased exposure to nature. This principle is supported by various studies in psychology and especially prevalent in terms of anxiety and depression (Bratman et al. 2015). Unfortunately, not enough people are conscious of it.
TECHNICAL DETAILS
This project was coded in C++/ Openframeworks, using a ofXPiMapper addon.
The methodology behind the collected data
SCENE 1.0
Each circle represents one of the 60 participants. Characteristics such as the age (size) and gender (colour) suggest a varied sample. This visualisation was achieved by converting excel files into vectors.
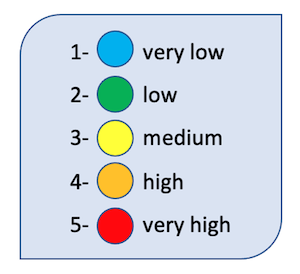
Colour mapped scores in anxiety/depression
SCENE 1.1
Visual representation of the results.
The key code function used in this scene is the ofMap(), as it allowed the transformation of numbers into visual cues. Moreover, vectors were composed using data extracted from excel files relevant to each mental health questionnaire: anxiety and depression.
The participants in the rural environment showed smaller indices of depression and anxiety. This can be clearly observed due to the red and orange participants on the urban side and the multitude of blue and green on the rural one. While normally such data would be reduced to a graph, this visual representation aids the clear conclusion: no matter the age or the gender, the built environment has a damaging effect on one’s mental health.
SCENE 2
The built setting.
What do you associate with an urban environment? Fast pace? Concrete? Dark colours? Bright lights? Do you think these might instead steer one away from relaxation?
SCENE 3
The natural environment.
With the use of sinuous lines and noisy movement, this scene suggests that it does indeed make sense that such stimuli are related to a better mental health. They attribute a meditative stance, allowing one to be present with their thoughts.
SELF-EVALUATION
As a beginner in code and art production, I feel that I went out of my comfort zone when carrying out this piece, especially considering the significant time restraints surrounding it. I encountered challenges and found creative ways to solve these, leading to personal growth. One aspect I struggled with was the speed of the wave, which I did not succeed in slowing down to my desired pace.
In the future, I would like to employ more artistic and technically advanced means in my practice, achieving a more complex visual experience in data and idea portrayal.
Code documentation:
Sine wave: https://forum.openframeworks.cc/t/drawing-a-curved-line/1141/3
Reading excel file: https://openframeworks.cc/learning/08_other/readfiletostringvector/
Bouncing ball: Workshops in Creative Coding-week 4
Text: https://openframeworks.cc/documentation/graphics/ofTrueTypeFont/#show_drawString
Research documentation:
Turner, W. R., Nakamura, T., Dinetti, M. (2004) Global urbanization and the separation of humans from nature. Bioscience, 54(6): 585–590.
Bratman, G., N., Daily, G., C., Levy, B., J., Gross, J., J. (2015) The benefits of nature experience: Improved affect and cognition. Landscape and Urban Planning, 13: 41–50.


